|
|
Post by eric on Jun 19, 2015 17:15:53 GMT -6
There's chaos, and violence, and random unpredictable evil that comes out of nowhere and rips you to shreds... but there's not just chaos. I took baseline Raef (50s in all but 25 Handling, Passing, Perimeter Defense), set up him up with four combinations of Potential and Scouted Potential (the one we see with a letter grade), and ran 40 training camps on each combination. He was 28 years old with 7 years of experience for all four. I also ran a full set on baseline Marcus Banks (twice traded with Shawn Marion for a player named O'Neal) (point guard, 50s in all but 25 Post Defense, Offensive and Defensive Rebounding), also age 28 with 7 years of experience. I finally ran a half set on 38 year old Raef, same experience.
Potential
The four combinations were [59, 32], [59, 82], [99, 32], [99, 82]. Hidden Potential is the only one that matters for attribute growth. However, Visible Potential is adjusted very strongly towards the one we don't see. The average change in Visible Potential by set was...
1	11
2	-13
3	26
4	1
...which correlates very well with the difference of Visible - Hidden. When Visible is higher than Hidden, it goes down. When Visible is lower, it goes up. The exact figure is very randomized, though. For set 3 the lowest change in Visible Potential was 16 and the highest was 44. With such extremes against the sample size it's not yet plausible to calculate the underlying distribution, but the general direction is useful. If you have a player whose Visible Potential goes from B to A, you can be confident their Hidden Potential is around 86 or higher. The correction did rarely overshoot, hence "around".
What we can calculate pretty well already is how Hidden Potential changes, though. In every set it had four possible outcomes, and they only depended on what Hidden Potential started at and age. For 28 year olds, 59 could drop by 4, 5, 6, or 7; 99 could drop by 7, 8, 9, or 10. For 38 year old Raef, could drop by 10, 11, 12, or 13. Additionally, the values were distributed such that the two edges were lower, the middle two were higher, and the middles were about the same and the edges were about the same. This is convenient mathematically because it lets us do...
edge % = a
middle % = b
2a + 2b = 100%
a + b = 50%

lowest possible ending Hidden Potential = x
next highest = x + 1
next highest = x + 2
highest = x + 3

x * a
(x + 1) * b
(x + 2) * b
(x + 3) * a

ax + bx + b + bx + 2b + ax + 3a
2ax + 2bx + 3a + 3b
(2x)(a + b) + 3(a + b)
(2x + 3)(a + b)
So regardless of the relative levels of a and b we can calculate precisely the average Hidden Potential from a start point, and it's just the arithmetic mean, which is nice. I'll use a larger array of Hidden Potentials and ages to nail down when the steps change.
.
Okay, but what does Hidden Potential do? A lot of stuff.
-For all positions and all attributes, there can never be more than a 5 point loss. I have 3000 data points and zero are -6 or smaller.
-For centers, there are four attributes that have a range of five: Three Point Shot, Quickness, Strength, Jumping. For a 28 year old center the change in these attributes will be +2, +1, 0, -1, or -2, and nothing else. For a 38 year old center, Three Point Shot will still change on the interval [+2,-2] but the athleticism ones will change on [-1,-4] - notice the reduced interval... 0 is forbidden? More research needed. For a 28 year old point guard, Three Point Shot is more free and the athleticisms are fixed to [+2,-2]. For both positions and ages, Jump Shot will change on [+3,-2]. The five point intervals are oddly distributed. As near as I can tell +2 0 -2 are at 22%, +1 -1 are at 17%. The differences between the observed values and 20% are statistically significant, so the distribution is definitely W-shaped. It is also definitely symmetric, so the average value is definitely 0.
The implications to this are pretty significant. Strength is a major attribute, and no matter what potential your guy has you won't expect it to go up or down. The sums of each set's change in athleticisms over 40 trials were +2, +3, -26, +17... or at most a quarter of a point per attribute.
-For 99 potential centers, some attributes went up A LOT. Averaged per trial...
[Shot Blocking, Post Defense, Drive Defense] went up 5 points
[Offensive Rebounding, Defensive Rebounding] went up 6 points
[Inside Scoring] went up 3 points
[Steals, Handling] went up 1 point
Now remember that the potential dropped by an average of 8.5 points for 28 year old Raef, so we definitely can't extrapolate by assuming his Shot Blocking would go up 5 points per year indefinitely. His 59 potential result was only half a point per year. I don't yet know what the curve looks like between those two points, but I'm pretty sure it's monotonic.
-I only did a 59 potential point guard, so I'm not sure which values go up big like that for point guards. My guess is Handling, Steals, and Perimeter Defense. Not Passing, and they also drop a point per trial in Inside Scoring, Offensive Rebounding, and Drive Defense.
-For 38 year old Raef with 99 Hidden Potential the strong growth was in the same areas, but it wasn't as pronounced, which combined with the decay in athleticism reduced his overall growth from about 35 points per trial to about 23.
.
So what's next? A lot more data. The main thing is to thoroughly chart out the aging/potential curve, first of all for centers. I'll also check to see if Experience factors in. Finally, I checked whether the hidden Scoring attribute changed during training camps: it did not. A guy who wants to score will always want to, a guy who doesn't always won't.
|
|
|
|
Post by kn88 on Jun 19, 2015 19:37:32 GMT -6
great stuff
|
|
Trofie
Former GM   
Posts: 6,207
Likes: 1,812
Joined: April 2014
|
Post by Trofie on Jun 19, 2015 19:48:29 GMT -6
Nice
|
|
|
|
Post by Citizen Cane on Jun 20, 2015 9:58:25 GMT -6
Interesting shit
|
|
|
|
Post by eric on Jun 23, 2015 19:03:37 GMT -6
I'm not quite done yet, but I have found several things that I wanted to get out there.
1. Negative Potential is possible
So what I did was I set up players with identical stats (attributes/height/weight/age/position) but for Hidden Potential, then set one each at 100, 90, 80, ... 20, 10, 0. I'll get more into this in a second, but Hidden Potential at 0 can go anywhere from +5 to -5, and 0 - 5 = -5. Hidden Potential cannot be manually set to a negative number, but can be manually set to any value from 0 to 100. This to me implies that any other value can grow to sub-0, which isn't super relevant. It could also be that a value can grow to super-100, though, which would very much be. It shouldn't be too hard to test, I just like to finish an area before going to another.
2. Hidden Potential change is piecewise
I had guessed that Hidden Potential would change as a function of the potential. We knew 99 changed on the interval [-10:-7] and 59 changed on the interval [-7:-4], so I figured it changed to [-9:-6] around 85, [-8:-5] around 70, [-6:-3] around 45, and so on. As it turns out, no! 100, 90, and 80 potential change on the interval [-10:-7] and with equal distributions. Same for 70 and 60 on the interval [-7:-4] and 50 through 0 on the interval [-5:+5]. So far I have only tested ages 25 through 28, and they have all been indistinguishable in this regard. I expect younger ages to have more forgiving Hidden Potential changes, otherwise nobody would be an A past their sophomore year. The change function being piecewise buttresses this: I wouldn't expect to see any change along this part of the age curve in a piecewise function.
All three pieces were symmetrical. Over the four years of forty trials each, the averages were...
80-100: -8.55 (predicted -8.50)
60-70_: -5.52 (predicted -5.50)
0-50__: +0.20 (predicted +0.00)
3. Hidden Potential effect is nearly linear
Even when two Hidden Potentials had the same change in Hidden Potential, they did not cause the same change in attributes. 0 Hidden Potential will not be included in any of this because there's a weird bug in the system when negative Hidden Potential results from a training camp. Dozens of times none of the attributes changed at all, and as this is an event that has about a 1 in 7 billion chance of happening randomly and it always happened when Hidden Potential went negative it is clearly a bug in the system. It is an interesting one for two reasons, though: it was determined only by what the Hidden Potential became rather than what it started as. The second reason is that while all bugs had negative Hidden Potential, a few negative Hidden Potentials didn't bug out. I don't know what that means.
3. What Potential Does
Anyway! Here's what happened. There are 15 attributes, and while 4 are constrained on the range [-2:+2] and the growth in the others is uneven, we can see the overall picture by looking at overall attribute growth per year:
HP	Growth
100	35
90	31
80	20
70	17
60	3
50	2
40	-8
30	-13
20	-22
10	-29
It looks more like five little lines than one big line, but the fit to one big line is still very good at .99 R^2. Now let's look at just 100 Hidden Potential and see how the attributes shook out:
growth	attribute
4	ins
0	jsh
0	3sh
1	han
0	qui
1	pas
2	ste
5	sho
4	poD
0	peD
4	drD
6	orb
6	drb
0	str
0	jum
So if you had a (25-28 year old) center with 100 potential, his training camp would on average be...
+2.00 Inside Scoring
+0.00 Outside Scoring
+0.83 Handling
+4.85 Defense
+4.80 Rebounding
So you would probably see a B+ to A- in Defense or Rebounding, but probably wouldn't see any grade changes anywhere else (and this is assuming your guy isn't already past the various soft caps for defense). Grade changes really come down to being precisely placed within given grades than the size of the change, because the change required to go from grade floor to grade floor is always bigger (and sometimes MUCH bigger) than the change you get from the training camp. Remember, though, grades don't matter at all. Attributes are the things that govern on-court performance.
.
A couple other minor things. I got out to 5000+ samples to try and figure out the distribution for athleticisms, but they're all so close together that it would take much more data, and to get that assumes the athleticism distribution on [-2:+2] doesn't change by age, and I just can't be arsed. I also tested a player with 27 years of experience but otherwise identical, and there was nothing different about him, so while experience has a measurable impact on play it has no measurable impact on training camps.
|
|
|
|
Post by Souper Troopers on Jun 23, 2015 19:49:45 GMT -6
|
|
|
|
Post by dilworth on Jun 23, 2015 20:20:06 GMT -6
Love this guy
|
|
|
|
Post by KwYawnza on Jun 24, 2015 6:37:04 GMT -6
I'm so bad at math
|
|
|
|
Post by eric on Jun 25, 2015 15:50:17 GMT -6
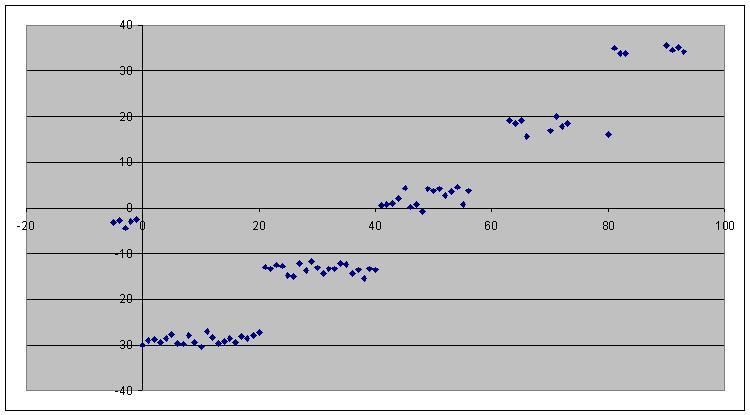 We've got Skynet by the b*lls now. The above is a graph of average attribute change against ending Hidden Potential rather than starting, taken over ages 20 to 29 with at 440 samples each age. Obviously this is the way to go: observe the jumps at 20->21, 40->41, and 80->81, even though only one starting Hidden Potential could generate both sets. It's over. min max attrib n avg
-5 -1 -537 170 -3.16
0 20 -24924 867 -28.75
21 40 -10577 784 -13.49
41 56 2475 979 2.53
63 80 15951 870 18.33
81 93 25235 730 34.57Now, a kind of weird thing is that the break points are 0, 21, 41, 61 (probably), and 81, which makes sense internally but doesn't match the number to grade mapping of ratings. I don't know why the coder would want to make two separate maps, but they did. Stuff happens. Anyway, the averages outside of the buggy Negative Zone look to me like they want to be -29, -13, 3, 19, 35, because those make nice gaps of 16. The growth isn't evenly distributed, and I'm still working that bit out. I've still never seen an attribute decrease by more than 5, I've never seen an attribute increase by more than 17, and I've seen a 17 increase as low as 70 Hidden Potential, but they're more common with 100 Hidden Potential. . The map of Hidden Potential changes is also quite well established for players in their 20s: [100, 90, and 80] have a 15% chance of -7, 35% of -8, 35% of -9, 15% of -10. Average: -8.5 predicted, -8.51 measured. [70, 60] have the same chances but for -4, -5, -6 and -7 respectively. Average: -5.5 predicted, -5.50 measured. [50, 40, 30, 20, 10, 0] have 5% chances of -5 or +5, then 10% chances of everything from -4 to +4. Average: 0 predicted, +0.11 measured. It could be 16. 6% and 33. 3% instead of 15% and 35%, but the signal difference is so small that I'd need an epic sample size to tell, and I think this way has better symmetry with the low potential design. I need to do a couple checks of the intervals from 70 to 80 and from 50 to 60 to find where specifically the transition points are, then we can map a player's potential change over time from any given starting point, and then we can convert that into attribute growth at every given year, and then we can convert those into Win Shares, and then we can determine the ultimate starting attribute configuration for a draft prospect. How do you like them apples, Arnold Schwarzenegger? . Last brief notes. -I have looked a little beyond the 20s decade and things change, but not that much. Hidden Potential changes go super haywire for teens with 80 90 100 potential, Athleticisms go to a [-3:+1] interval for 30. A lot more research is required for them, but the changes are decade based. -I mentioned earlier how Hidden Potential can go negative, and wondered if any other attribute could naturally exceed caps. The answer is no. Attributes can't go above 100 or below 5 under any circumstances. |
|
|
|
Post by Druce on Jun 25, 2015 15:56:01 GMT -6
this all sounds cool but i'm going to be honest i have no idea what it means.
|
|
|
|
Post by eric on Jun 25, 2015 17:22:43 GMT -6
fair enough druce. say goodbye to your year 3 contender slot >:|
Next post I'll have enough information to map out a center's growth over time, so I'll mock up two prospects and we can watch them grow twice.
|
|
|
|
Post by Odin on Jun 25, 2015 18:26:20 GMT -6
nothing wrong with 50 pot imo
|
|
Mad King
Former GM    Mel my queen
Posts: 3,451
Likes: 640
Dump Bucks: 1,000
Joined: April 2014
|
Post by Mad King on Jun 26, 2015 6:30:34 GMT -6
why is your testers 28 and 38? seems pointless because nobody is 38 under 20 something and nobody is 28 above 80 imo.
|
|
|
|
Post by eric on Jun 26, 2015 9:17:17 GMT -6
why is your testers 28 and 38? seems pointless because nobody is 38 under 20 something and nobody is 28 above 80 imo. The point of that test was to see if age had an effect with all else being equal. It did: potential decreased more, stats grew less. I then tested an array of ages with an array of Hidden Potentials... age 20 (0, 10, 20, ... , 90, 100 potential) age 21 (0, 10, 20, ... , 90, 100 potential) ... age 28 (0, 10, 20, ... , 90, 100 potential) age 29 (0, 10, 20, ... , 90, 100 potential) On this range age didn't matter, only potential. Thus we know that age has a piecewise function rather than a continuous one. This is convenient because we can map a player's growth throughout his 20s with just their Hidden Potential. (I'm also testing ages 17-19 and 30+, I just haven't finished them yet.) The age 28 and age 38 data in the first post isn't involved anymore. |
|
|
|
Post by eric on Jun 27, 2015 14:00:43 GMT -6
Okay, we're gonna have two posts here. The first one is going to be solid data, the second will be Training Camp simulations. Slide onto the next one if you're not interested in lots and lots and lots (and lots) of numbers. To review briefly... There are five Tiers of stat growth based on Hidden Potential: 0 to 20 (1), 21 to 40 (2), 41 to 60 (3), 61 to 80 (4), 81 to 100 (5). There are two basic kinds of attributes: ones that grow from -2 to 2(ish), and ones that grow from -5 to X where X depends on the potential Tier. The distributions of the former are flat except for Jump Shot, which is beveled at higher Tiers. The distributions of the latter attributes follow a basic pattern of beveled with a positive tail. Lower Tiers have less diversity. Tier 1 has 2 distributions, Tier 2 has 3, Tiers 3 and 4 have 7, Tier 5 has 8. Illustrations. Flat distribution, where all probabilities are the same. _____Beveled distribution, where probabilities at the edge of the distribution are lower. _____
/ \Beveled distribution with tail, where probabilities at the edge of the main distribution are lower, then the high fringe is much lower. _____
/ \
| |___
\The wide growth distributions are the last kind until Tier 5, where they're all beveled except for Inside Scoring. Here's the data: 1 a b
-5 976
-4 2114
-3 2133
-2 893 2035
-1 901 1155
0 844 105
1 874 101
2 823 51
2 a b c
-5 455 106
-4 884 227
-3 842 205
-2 803 876 235
-1 779 895 197
0 806 835 201
1 730 859 206
2 802 436 128
3 74 23
4 77 16
5 39 17
6 7
3 a b c d e f g
-5 129 116 52 109 85
-4 307 196 75 152 207
-3 284 174 93 187 180
-2 1000 190 292 174 111 205 171
-1 789 197 287 195 79 187 151
0 760 207 309 200 98 177 169
1 810 177 283 188 90 200 192
2 766 199 298 229 93 191 184
3 9 281 165 105 187 163
4 284 198 97 196 163
5 164 93 55 99 167
6 19 14 9 3 85
7 9 8 14 16
8 7 11 18 20
9 3 12 5
10 15
11 6
4 a b c d e f g
-5 113 60 33 50 70
-4 243 138 56 126 104
-3 250 136 52 104 108
-2 716 98 220 139 67 128 109
-1 744 149 246 135 62 116 120
0 666 171 223 114 59 90 114
1 650 194 229 140 60 106 131
2 704 177 237 139 64 111 105
3 81 222 131 58 109 127
4 245 163 67 102 120
5 248 131 51 89 123
6 126 137 79 118 125
7 8 119 60 99 127
8 45 49 83 129
9 7 37 111 83
10 6 6 108 3
11 4 63 11
12 6 6 5
13 8 5
14 9 6
15 4 6
16 6
17 3
5 a b c d e f g h
-5 99 20 17 40 27 24
-4 169 47 33 61 67 52
-3 183 55 36 76 67 48
-2 594 67 198 57 46 87 72 45
-1 579 150 162 51 47 76 59 36
0 573 151 167 58 46 74 56 39
1 579 140 196 55 45 79 61 44
2 595 153 169 42 39 76 69 51
3 69 196 59 52 83 76 43
4 189 54 37 73 71 43
5 185 46 36 74 86 47
6 183 33 49 60 53 46
7 94 47 25 82 59 43
8 48 38 70 68 49
9 40 44 67 76 54
10 18 34 68 77 25
11 44 64 66 13
12 45 73 69 21
13 17 74 63 7
14 64 49
15 39 70
16 59
17 40 Tier 1 a distribution covers Jump Shot, Three Point Shot, Quickness, Strength, and Jumping. b distribution covers Inside Scoring, Handling, Passing, Stealing, Shot Blocking, Post Defense, Perimeter Defense, Drive Defense, Offensive and Defensive Rebounding. Tier 2 a distribution is the same b distribution is the same except for Rebounding c distribution covers Rebounding Tier 3 and 4 a distribution covers Three Point Shot, Quickness, Strength, and Jumping b distribution covers Jump Shot c distribution covers Handling, Passing, Quickness d distribution covers Inside Scoring, Stealing e distribution covers Drive Defense f distribution covers Shot Blocking and Post Defense g distribution covers Rebounding Tier 5 h distribution covers Inside Scoring everything else is the same Now, I'm confident that the underlying math works this way. Quantify the beveled edge and tail, then divide up what remains into the remaining flat part of the distribution. This makes for some ugly numbers but here they are rounded off... 1 a b
-5 12.5
-4 24.17
-3 24.17
-2 20 24.17
-1 20 12.5
0 20 1
1 20 1
2 20 0.5
2 b c
-5 7 7
-4 13.92 13.75
-3 13.92 13.75
-2 13.92 13.75
-1 13.92 13.75
0 13.92 13.75
1 13.92 13.75
2 7 7
3 1 1
4 1 1
5 0.5 1
6 0.5
3 b c d e f g
-5 5 5 5 5 5
-4 9.94 9.83 9.78 9.67 8.85
-3 9.94 9.83 9.78 9.67 8.85
-2 19.90 9.94 9.83 9.78 9.67 8.85
-1 19.90 9.94 9.83 9.78 9.67 8.85
0 19.90 9.94 9.83 9.78 9.67 8.85
1 19.90 9.94 9.83 9.78 9.67 8.85
2 19.90 9.94 9.83 9.78 9.67 8.85
3 0.5 9.94 9.83 9.78 9.67 8.85
4 9.94 9.83 9.78 9.67 8.85
5 5 5 5 5 8.85
6 0.5 0.5 0.5 0.5 5
7 0.5 0.5 0.5 0.5
8 0.5 0.5 0.5 0.5
9 0.5 0.5 0.5
10 0.5
11 0.5
4 b c d e f g
-5 4.5 3.5 3.5 3.5 3.5
-4 9.05 7.67 7.04 6.07 6.85
-3 9.05 7.67 7.04 6.07 6.85
-2 10 9.05 7.67 7.04 6.07 6.85
-1 20 9.05 7.67 7.04 6.07 6.85
0 20 9.05 7.67 7.04 6.07 6.85
1 20 9.05 7.67 7.04 6.07 6.85
2 20 9.05 7.67 7.04 6.07 6.85
3 10 9.05 7.67 7.04 6.07 6.85
4 9.05 7.67 7.04 6.07 6.85
5 9.05 7.67 7.04 6.07 6.85
6 4.5 7.67 7.04 6.07 6.85
7 0.5 7.67 7.04 6.07 6.85
8 3.5 7.04 6.07 6.85
9 0.5 3.5 6.07 3.5
10 0.5 0.5 6.07 0.5
11 0.5 3.5 0.5
12 0.5 0.5 0.5
13 0.5 0.5
14 0.5 0.5
15 0.5 0.5
16 0.5
17 0.5
5 b c d e f g h
-5 5 2.5 2.5 2.5 2.5 3.5
-4 8.18 6.79 5.59 5.00 4.52 6.29
-3 8.18 6.79 5.59 5.00 4.52 6.29
-2 10 8.18 6.79 5.59 5.00 4.52 6.29
-1 20 8.18 6.79 5.59 5.00 4.52 6.29
0 20 8.18 6.79 5.59 5.00 4.52 6.29
1 20 8.18 6.79 5.59 5.00 4.52 6.29
2 20 8.18 6.79 5.59 5.00 4.52 6.29
3 10 8.18 6.79 5.59 5.00 4.52 6.29
4 8.18 6.79 5.59 5.00 4.52 6.29
5 8.18 6.79 5.59 5.00 4.52 6.29
6 8.18 6.79 5.59 5.00 4.52 6.29
7 5 6.79 5.59 5.00 4.52 6.29
8 6.79 5.59 5.00 4.52 6.29
9 6.79 5.59 5.00 4.52 6.29
10 2.5 5.59 5.00 4.52 3.5
11 5.59 5.00 4.52 1.7
12 5.59 5.00 4.52 1.7
13 2.5 5.00 4.52 1.7
14 5.00 4.52
15 2.5 4.52
16 4.52
17 2.5 And here are the average results per attribute per tier: tier ins jsh 3sh han qui pas ste sho poD peD drD orb drb str jum total
1 -2.90 0.00 0.00 -2.90 0.00 -2.90 -2.90 -2.90 -2.90 -2.90 -2.90 -2.90 -2.90 0.00 0.00 -29.00
2 -1.38 0.00 0.00 -1.38 0.00 -1.38 -1.38 -1.38 -1.38 -1.38 -1.38 -1.20 -1.20 0.00 0.00 -13.44
3 0.11 0.01 0.00 0.03 0.00 0.03 0.11 0.26 0.26 0.03 0.15 0.61 0.61 0.00 0.00 2.21
4 1.58 0.50 0.00 0.53 0.00 0.53 1.58 3.21 3.21 0.53 2.14 2.46 2.46 0.00 0.00 18.73
5 2.98 0.50 0.00 1.00 0.00 1.00 2.50 5.00 5.00 1.00 4.00 6.00 6.00 0.00 0.00 34.98. Now, a few things. First, long tailed distributions are tricky because they're such tiny signals, so you can have a great signal to noise ratio in the bulk of the distribution and be guessing at the tail. I got around this by assuming the tails were similar within a tier, they might not be. Second and more importantly, getting the distributions exactly right isn't very important for modeling attribute growth. The average is extremely stable: changing from 0.5% to 1% in the tail is obviously double for that particular value, but we're talking about 0.005 * 17 (for example) = 0.085 less however much you're taking away from the rest of the distribution. Finally, I would have coded it so that a given attribute would be the biggest growth at all Tiers. For some reason the coder of this software didn't do that, and I can't figure out what they were going for. Rebounding for centers is the only attribute that can ever grow 17, and it has the biggest average growth in most Tiers... but not all of them. It has a higher relative proportion of its distribution in the tail for Tier 4 so its average is lower... but then Shot Blocking / Post Defense has the highest possible growth in Tier 3 and a lower average. I don't know why it's built that way. . Next up: projections!  |
|
|
|
Post by eric on Jun 27, 2015 15:23:21 GMT -6
There are two ways to look at projections. We can take the averages of each distribution, or we can roll against a table of the possibilities and do a bunch of real life (so to speak) examples. There's advantages to each way. The average approach you only have to run once and it can tell you what to expect from a given starting point, but the table approach can illustrate wrinkles in the distributions. For example, consider 100 Hidden Potential. It's going to decrease from between 7 and 10 points, and we're going to get Tier 5 growth for anything from 81 to 100. On average we'll get two years of Tier 5 growth, because 100 - 8.5 - 8.5 = 83 > 81. There is a small chance we only get one year, though, because 100 - 10 - 10 = 80 < 81. Specifically that chance is 1.25%, but the important thing is that there are microstates that aren't communicated by the average. So let's do both!
As our test subjects I'm going to try out three guys.
C	C	D+	C+	C	- Raef Reborn
B+	C	D+	A+	A	- Great White Hype
B+	C	C-	B+	A-	- Blue Chipper
All age 21, all 100 potential, so they're all going to get 2 tier 5s, 3 tier 4s, and 4 tier 3s. After their age 29 TC their grades are...
C+	C+	C-	A-	B  - RR
B+	C+	C-	A+	A  - GWH
A-	C+	C	A	A - BC
Or +10 for Raef, +2 for Whitey, and +6 for ol' Blue. However, over these 10 years the Win Shares generated by each attribute set are led far and away by the middle option...
GWH - RR = 160
GWH - BC = 75
.
Now let's try the table approach, and let's focus on Raef. We'll do three fully random ones, then a best potential case, then a worst potential case. The three random ones ended up as...
C+	C+	C-	A-	B #1
C+	C	D+	A-	B+ #2
C+	C	D+	B+	B #3
...and Rando #2 was 6 Win Shares ahead of #1 and 23 ahead of #3. If we look at #2 to #3, that's two wins per season from a single player who started in an identical place, and this is only the randomness from Training Camps.
C+	C+	C-	A-	B  best
C+	C	C-	B	B-  worst
I used average returns on potential and only looked at the best/worst cases for potential drops. That's a possible +5 difference just on potential rolls. Best/worst cases on attribute growth are prohibitively unlikely and just silly, it would be F- across or A B+ A A+ A. The attributes for each build were...
Raef: 50s in everything but 25 in Handling, Passing, and Perimeter Defense
GWH_: same but 100 in Inside Scoring, Stealing, Shot Blocking, Post Defense, Drive Defense, both Reboundings (i.e. the fastest growing attributes)
BChi: same as Raef but 100 in Quickness, Strength, and Jumping (i.e. the non growing attributes)
I don't know how prospects are designed, but if we're in a point-buy system it's interesting catching up on 43% of the attribute points can make up 59% of the Win Shares difference if you put them in the right spot.
.
I'm in this stuff pretty deep, so it might not make as much sense to outsiders. If anything is unclear, or if anyone has other questions about this, please let me know! :)
|
|
|
|
Post by Odin on Jun 28, 2015 9:23:16 GMT -6
This is some great shit.
|
|
Trofie
Former GM   
Posts: 6,207
Likes: 1,812
Joined: April 2014
|
Post by Trofie on Jun 28, 2015 17:08:19 GMT -6
Fantastic
|
|
|
|
Post by KwYawnza on Jun 29, 2015 8:21:59 GMT -6
Skynet by the balls. Good lord.
|
|
Buster 5000
Former GM   
Posts: 4,828
Likes: 1,382
Dump Bucks: 10,950
Joined: April 2014
|
Post by Buster 5000 on Jun 29, 2015 10:52:36 GMT -6
My brain hurts.
|
|
|
|
Post by eric on Jun 29, 2015 15:41:40 GMT -6
Thanks everyone  Two things today. Only this first one is really useful to GMs now that we can't scout true potential anymore, but here's how visible potential changes based on hidden potential: VP = .5 * HP + 25 ± 15 So if your hidden potential goes to 50 in a training camp, your visible potential will be somewhere between 65 (B) and 35 (D). Here's what that looked like graphically, with hidden potential on the x axis and visible on the y: 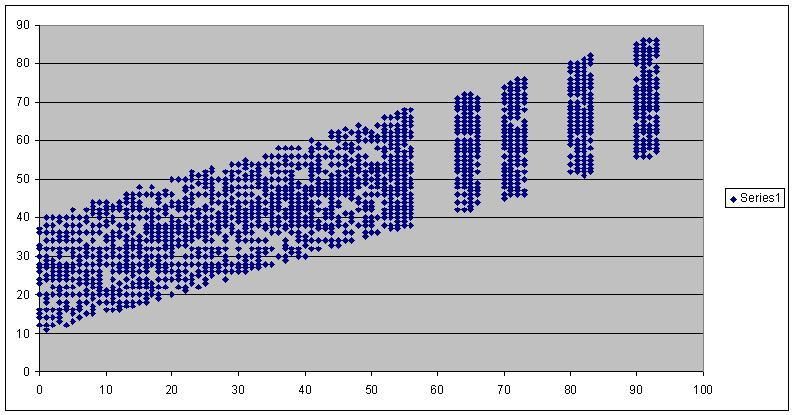 Now, we can't see our visible potential number, only the letter grade. This makes it kind of hard to tell anything from it most of the time. Consider... 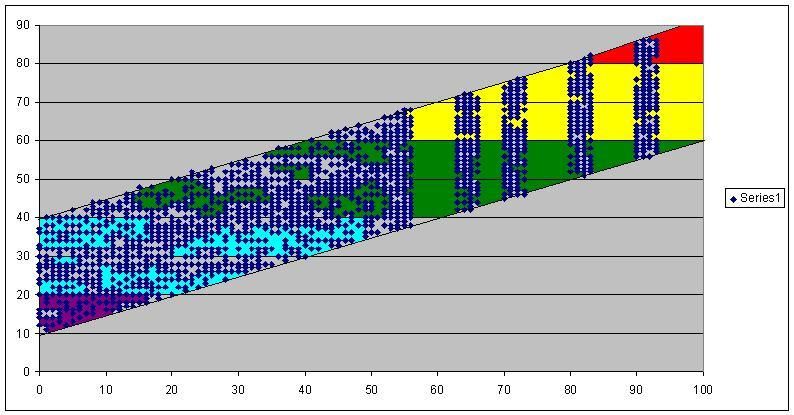 Each colored area is a grade range. Red for A, yellow for B, and so on. If you have a visible potential of C, your hidden potential could be anything from 0 to 100. It literally tells you nothing. If you have A after at least one training camp you know you're in good shape, ditto for F and terrible shape. With that said, the distribution for the ± 15 isn't flat, so it's more likely to be in the middle than on the edges: 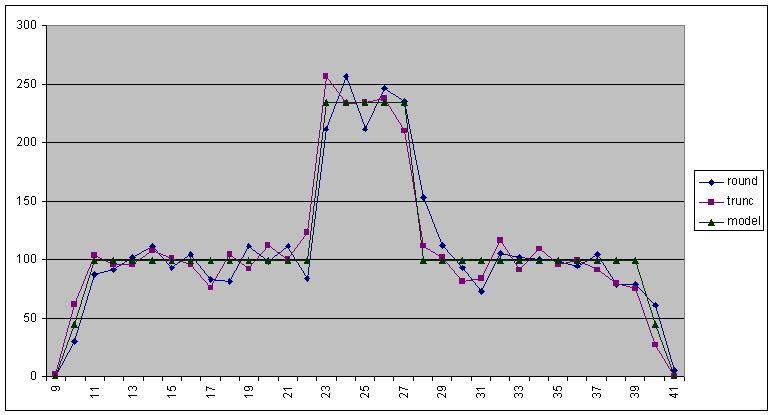 I don't know exactly how the system treats rounding, so I graphed it against the system rounding or truncating and either way it fits well. It's 6.5% for the mean and the two values on either side, 1.25% for each of the farthest fringes, 65%/24 for everything else; .065 * 5 + .0125 * 2 + .0271 * 24 = 1. Thus you have about a 1/3 chance to be only ± 2 from your mean. . Now for the good stuff. I mentioned before how we can map how hidden potential changes, and I thought it would be interesting to see how many of each Tier you would get over a ten year period (age 20 to age 29). Remember: Tier 5 is massive growth, Tier 4 is growth, Tier 3 is stable, Tier 2 is decay, Tier 1 is massive decay. So what I did was calculated the % chance hidden potential had to land on any given # in every given year, then added them up for each Tier. Because there are three regimes of hidden potential change, and the third can have growth and decay where the first two can only decay, there are notches and nonlinearities everywhere. Here's how it looks: 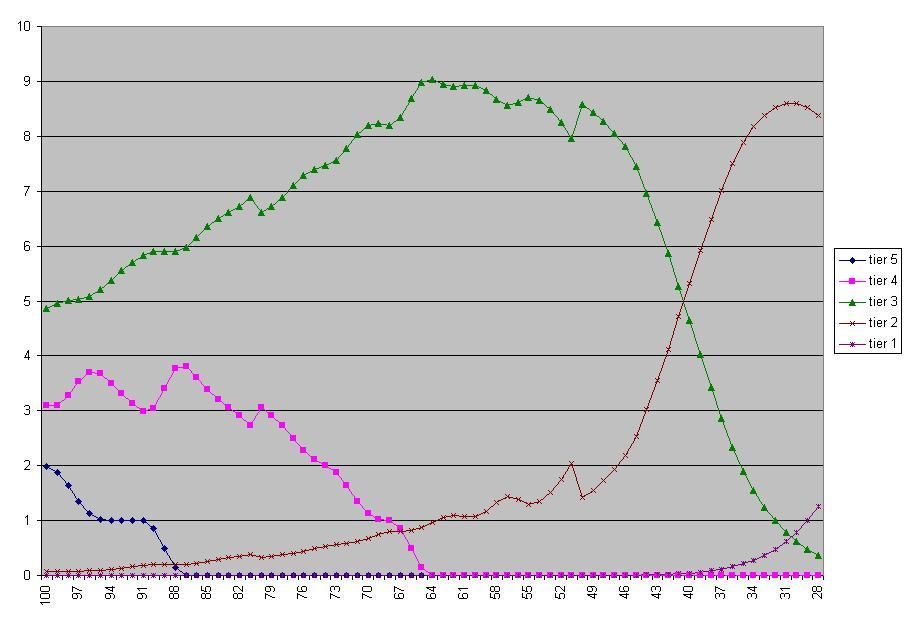 There's technically another Tier beyond Tier 1, but it's the one with negative potentials where things get weird, on this graph it never makes up more than a thousandth of the overall potential, it would only make the overall growth slightly higher, and it first appears at 51 starting potential. There's a lot of things to take away from this graph. It's really hard to get those big Tier 5 jumps. If visible potential was faithful to hidden potential, you would have to be an A, and not even a low A. Getting appreciable growth with Tier 4s is more forgiving, but you'd still need B. We can also look at the overall growth, and there's interesting things there too: 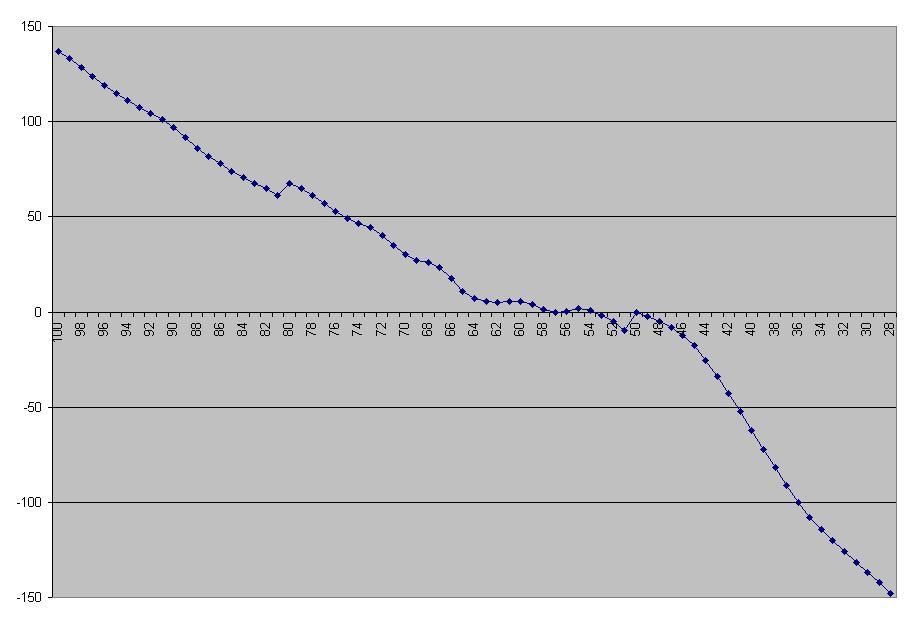 Those notches aren't graphical errors. 136.948280 100
133.280127 99
128.679259 98
123.555331 97
118.765935 96
114.625599 95
110.862044 94
107.325934 93
104.140948 92
101.205826 91
97.142747 90
91.569946 89
86.031708 88
81.756056 87
78.063596 86
74.075521 85
70.438032 84
67.478580 83
67.478580 80
64.717495 82
64.717495 79
61.297136 81
61.297136 78
56.980644 77
52.546161 76
49.088254 75
46.722349 74
44.147422 73
40.019287 72
34.709990 71
30.026100 70
27.204691 69
26.088190 68
23.386857 67
17.459763 66
10.905335 65
6.893082 64
5.426183 63
5.360547 61
5.310815 60
4.979689 62
3.913847 59
1.746742 55
1.175431 58
1.047849 54
0.349275 56
-0.170748 50
-0.486597 57
-1.723418 53
-2.315384 49
-5.060283 48
-5.193013 52
-8.337066 47
-9.831711 51
-12.108427 46
-17.795025 45
-25.525310 44
-33.935406 43
-42.944162 42
-52.466698 41
-62.306442 40
-72.151016 39
-81.788209 38
-91.119285 37
-100.060581 36
-107.774288 35
-114.247981 34
-120.295283 33
-125.976855 32
-131.368890 31
-136.637020 30
-142.029305 29
-147.711309 28Think of it this way. If you start with 83 potential, you don't get a Tier 5 growth but you do get the big drop of -7:-10. If you start with 80 potential, you still don't get a Tier 5 growth and you get the smaller drop of -4:-7. Things get really crazy around 50 because you want to drop onto 50 (where potential change goes to +5:-5) but not too far past it, because then the next year you can drop to 40 and get attribute decay. I have no idea if the software designer calculated this all out. That 50 starting potential works out to almost exactly 0 growth over 10 years makes me think he did. That 80 starting potential works out better than 82 makes me think he didn't. Who knows. For design purposes, anything from 65 to 46 will stay pretty much the same. Above and below that area the change is basically linear, although the negative line is steeper. Also please note that these values are purely attribute change, and because some attributes change more than others a given player might see less growth, for instance if you make a 100 potential 100 shot blocking 100 rebounding center his growth will appear stunted... but no one will care because those stats have a huge impact on Win Shares so having less growth isn't a big deal. |
|
|
|
Post by Lazy Pete on Jun 29, 2015 15:53:15 GMT -6
I don't believe you're doing any actual analysis anymore. I'm pretty sure these graphs came from my sophomore statistics text book
|
|
|
|
Post by eric on Jun 29, 2015 15:58:58 GMT -6
Even the rainbow one??? Typical liberal college garbage.
|
|
|
|
Post by ANK1990 on Jun 29, 2015 18:50:53 GMT -6
|
|
|
|
Post by eric on Jul 1, 2015 15:58:04 GMT -6
Okay, good news and bad news. Good news is that attribute growth is identical to 20s for teens, and almost identical for 30s. The only difference in 30s is, as one might guess, athleticism. Instead of having an even distribution on [-2:+2], Quickness/Strength/Jumping has an uneven distribution on [-3:+1]: 20% for -3, 30% for -2, 20% for -1 and 0, 10% for +1. This changes the average expected change from 0 to -1.3, which in turn predicts a difference (for any given tier) of -3.9, and in fact I measured a difference of -3.81, so nice. I also checked the distributions for other attributes, and they were the same: same range, same average, same everything. Bad news is that potential change is very, very different. 30s aren't too bad, it's all the same distributions but offset by -3. Thus... 81-100 potential changes on [-13:-10] instead of [-10:-7], 51-80 potential changes on [-10:-7] instead of [-7:-4], and 0-50 potential changes on [-8:+2] instead of [-5:+5]. One annoying thing is that while 30 has attribute changes like any other 3x year, it has potential changes like ages 20-29. I don't know if this was intentional or not. Any player that starts aged 17-22 is guaranteed to be 55 or lower before their age 31 TC. We could do the overall growth map per potential but spoiler alert, it's always big and negative. The more interesting question for me are a player's chances of hitting Tiers 2 and 1, the major decline regions. Here's a table: 2 1
chance 5 50 95 5 50 95
55 2 3 5 6 9 x
54 2 3 5 6 9 x
53 2 3 4 6 8 x
52 2 2 4 6 8 x
51 2 2 4 6 8 10
50 2 3 5 6 9 x
49 2 3 5 6 9 x
48 1 3 5 6 8 x
47 1 2 4 6 8 x
46 1 2 4 5 8 x
45 1 2 3 5 7 10
44 1 2 3 5 7 10
43 1 1 3 5 7 10
42 1 1 3 4 7 9
41 1 1 2 4 6 9
40 1 1 2 4 6 9
39 1 1 1 4 6 8
38 1 1 1 4 6 8
37 1 1 1 3 5 8
36 1 1 1 3 5 7
35 1 1 1 3 5 7Now here's how to read it. I've calculated how many training camps a player with a given potential at age 30 has to undergo to have a 5%, 50%, and 95% chance to get a Tier 2 or Tier 1 camp. Thus pretty much everyone is going to take some Tier 2s on the chin, and pretty quickly too, while a player has to be 34+ to have a realistic chance at Tier 1 devastation. I've also calculated the average potential going into the age 30 training camp for players who go into their age 20 training camp with the given potential: 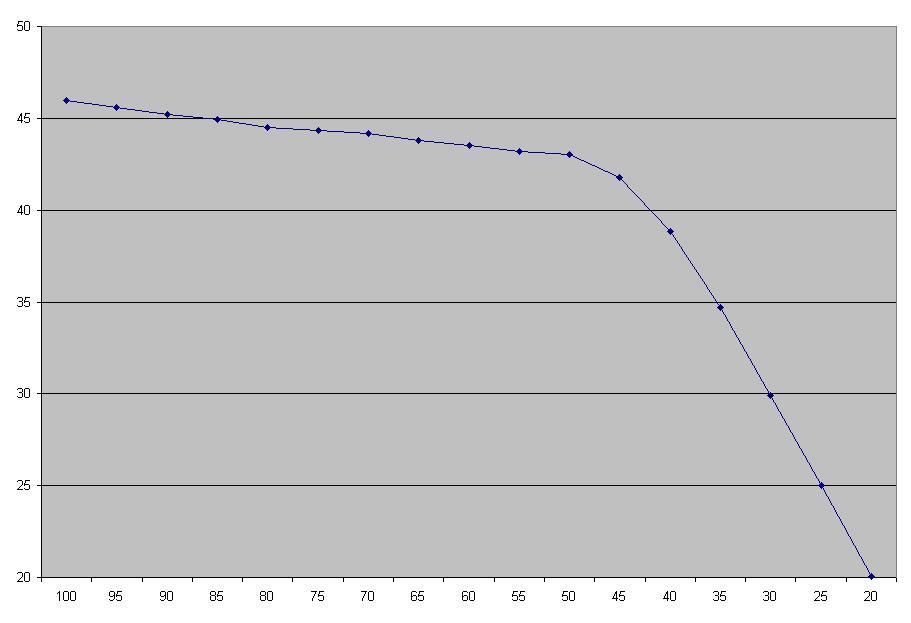 As you can see any player that's actually going to be made is going to end up around 45, which in turn means that you should start to be very wary of a player going into an age 36 training camp because there's a 50% shot they're going to hit Tier 1. . Teens potential is an entirely different thing, altogether. Everything from 70 and below is mercifully the same, while everything from 71 up follows this pattern: 25% chance of going down by (potential / 5) 25% chance of going down on [-6:-2] evenly distributed 25% chance of staying the same 25% chance of going up(!) on [+1:+20](!!!), max of 100 So if a 17 year old has 100 potential, they can take either of these paths... 1. Stay at 100, age 17 tc Tier 5. Stay at 100, age 18 tc Tier 5. 75% chance of being no lower than 94, age 19 tc Tier 5. Guaranteed age 20 tc Tier 5. (37.5% overall chance.) 2. Drop to 80, age 17 tc Tier 4. Drop to 64, age 18 tc tier 4. Guaranteed age 19 and age 20 tier 3. (6.25%) That's an overall attribute growth difference of 98 points over four years, and the gap continues to widen. The boom or bust capacity for age 17 players is just unbelievable, to the point where averages are severely misleading. With that said, here are the average ending potentials for an age 17 player with given starting potential: 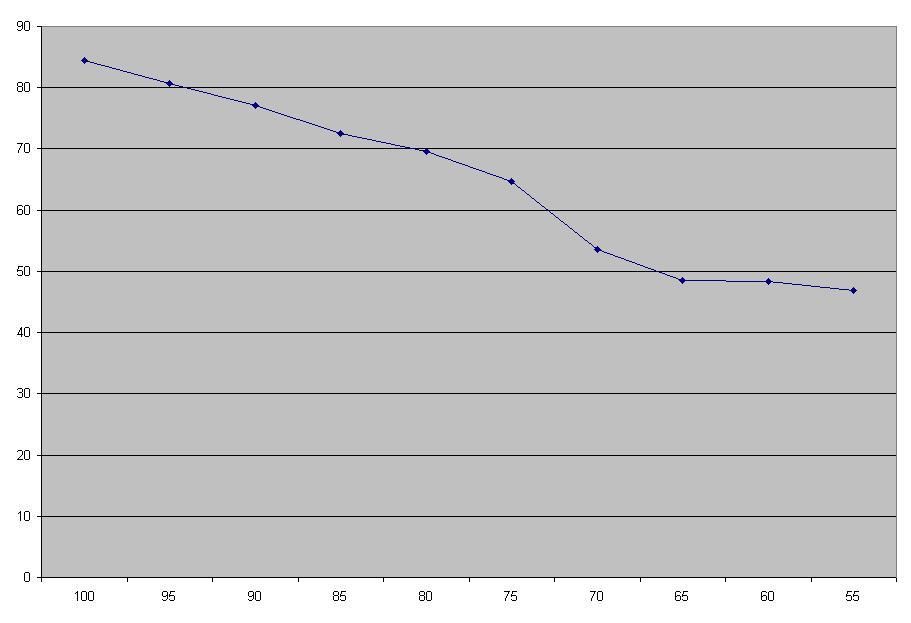 It ends up pretty linear, but if you need a sure thing stay far far away from teenagers. . That's it for Raef. I'm going to take a brief siesta into injuries/position stuff, then I'll move on to Raef analysis for point guards. Hopefully the distributions are just changed to different stats, but we'll find out one way or another. |
|


