Post by eric on Jul 2, 2015 16:10:24 GMT -6
Injuries can derail even the best teams. Is there any way to avoid them?
No.
.
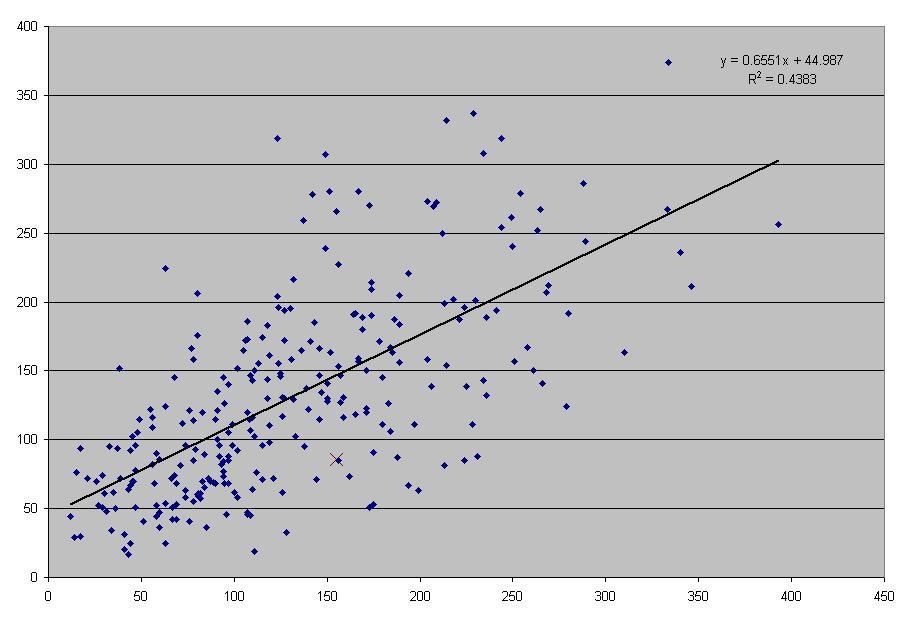
I simulated an identical league 40 times, then I did so again after changing a single player's attributes from all 5s to all 100s. If avoiding injury is an ability rather than luck, we should see correlation from one sample to the other, and we do:

However, note the location of the red X near (150,100). That's the player I changed, and the blue diamond directly next to him was a player identical from year to year (Zarko Cabarkapa, who as a Montenegrin NOT named Nikola couldn't hack it in the NBA). This suggests attributes aren't relevant, especially since the numbers of games missed in the second season is on the x-axis; that is, the superman missed more games than the milquetoast. To be sure, let's do a linear regression of every characteristic against games missed and see how our R^2 looks:
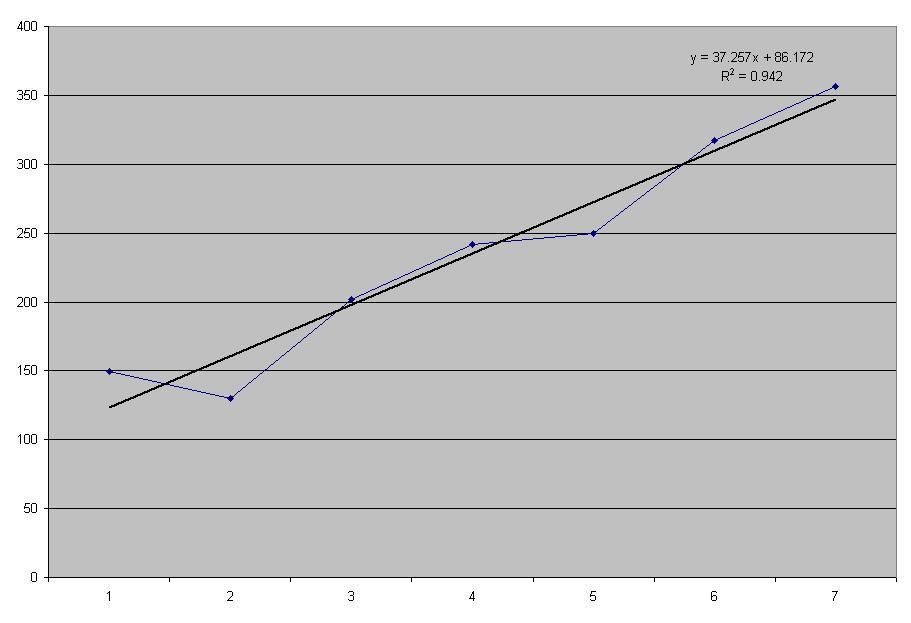
Outside of Age (and therefore Experience) and CurrentRating, there's no correlation about 0.1, so what's the deal? How are the two samples consistent with each other? If we bin out players by combined minutes per game, we get...

That is, the more minutes a player plays the more likely he is to hurt himself. This makes sense, and playing time is very consistent for a given player. If we look at only the players who played between 50 and 60 combined minutes per game (so averaging 25-30), we get...
Again, Age and CurrentRating are the identifiable parameters. Old players get hurt more, better players play more and therefore get hurt more. No individual attribute (or even rating) can unilaterally define a better player, so none of them have significant R^2s. This also means there's nothing you can do to keep your player from getting injured except not play him, but on the plus side there's no such thing as an injury-prone player. There's just no field for it in the program, and because no existing attribute has that effect it does not exist.
It's all luck.
A curiosity: there were no iron men in either 40 year sample. Everyone ended up missing games sooner or later. The fewest games missed in the first sample was 17 by Stanislav Medvedenko (missed no more than 5 in a given season), second sample was 12 by Joel Przybilla (missed no more than 6 in a given season). In the opposite sample, Slava missed 43 and Joel missed 44... not even good enough for top ten.
No.
.
I simulated an identical league 40 times, then I did so again after changing a single player's attributes from all 5s to all 100s. If avoiding injury is an ability rather than luck, we should see correlation from one sample to the other, and we do:

However, note the location of the red X near (150,100). That's the player I changed, and the blue diamond directly next to him was a player identical from year to year (Zarko Cabarkapa, who as a Montenegrin NOT named Nikola couldn't hack it in the NBA). This suggests attributes aren't relevant, especially since the numbers of games missed in the second season is on the x-axis; that is, the superman missed more games than the milquetoast. To be sure, let's do a linear regression of every characteristic against games missed and see how our R^2 looks:
all	characteristic
0.006	Height
0.002	Weight
0.311	Age
0.000	PositionNumber
0.333	Experience
0.049	Potential
0.044	KnownPotential
0.076	InsideScoring
0.046	JumpShot
0.015	ThreePointShot
0.011	Scoring
0.005	Handling
0.072	Passing
0.002	Quickness
0.018	PostDefense
0.023	PerimeterDefense
0.012	DriveDefense
0.011	Stealing
0.000	ShotBlocking
0.001	OffenseRebound
0.015	DefenseRebound
0.003	Strength
0.004	Jumping
0.051	RatingInsideScoring
0.026	RatingOutsideScoring
0.053	RatingHandling
0.038	RatingDefense
0.003	RatingRebounding
0.163	CurrentRating
0.027	FutureRating
Outside of Age (and therefore Experience) and CurrentRating, there's no correlation about 0.1, so what's the deal? How are the two samples consistent with each other? If we bin out players by combined minutes per game, we get...

That is, the more minutes a player plays the more likely he is to hurt himself. This makes sense, and playing time is very consistent for a given player. If we look at only the players who played between 50 and 60 combined minutes per game (so averaging 25-30), we get...
tier 5	characteristic
0.030	Height
0.009	Weight
0.703	Age
0.003	PositionNumber
0.659	Experience
0.116	Potential
0.085	KnownPotential
0.057	InsideScoring
0.088	JumpShot
0.000	ThreePointShot
0.014	Scoring
0.066	Handling
0.041	Passing
0.010	Quickness
0.033	PostDefense
0.002	PerimeterDefense
0.005	DriveDefense
0.003	Stealing
0.000	ShotBlocking
0.007	OffenseRebound
0.015	DefenseRebound
0.005	Strength
0.020	Jumping
0.024	RatingInsideScoring
0.006	RatingOutsideScoring
0.029	RatingHandling
0.000	RatingDefense
0.000	RatingRebounding
0.112	CurrentRating
0.193	FutureRating
Again, Age and CurrentRating are the identifiable parameters. Old players get hurt more, better players play more and therefore get hurt more. No individual attribute (or even rating) can unilaterally define a better player, so none of them have significant R^2s. This also means there's nothing you can do to keep your player from getting injured except not play him, but on the plus side there's no such thing as an injury-prone player. There's just no field for it in the program, and because no existing attribute has that effect it does not exist.
It's all luck.
A curiosity: there were no iron men in either 40 year sample. Everyone ended up missing games sooner or later. The fewest games missed in the first sample was 17 by Stanislav Medvedenko (missed no more than 5 in a given season), second sample was 12 by Joel Przybilla (missed no more than 6 in a given season). In the opposite sample, Slava missed 43 and Joel missed 44... not even good enough for top ten.


