|
|
Post by eric on Dec 28, 2015 18:21:18 GMT -6
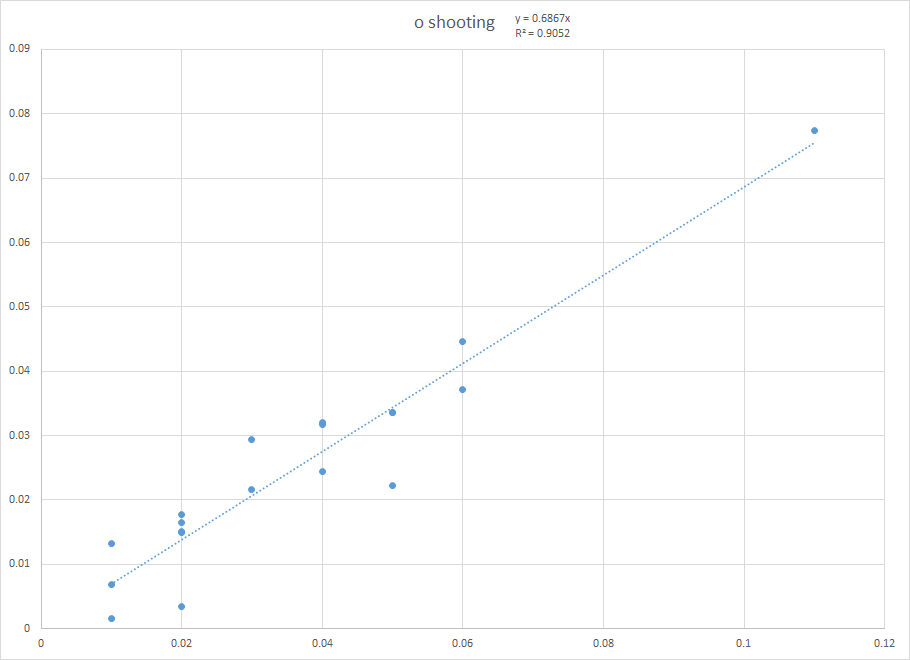
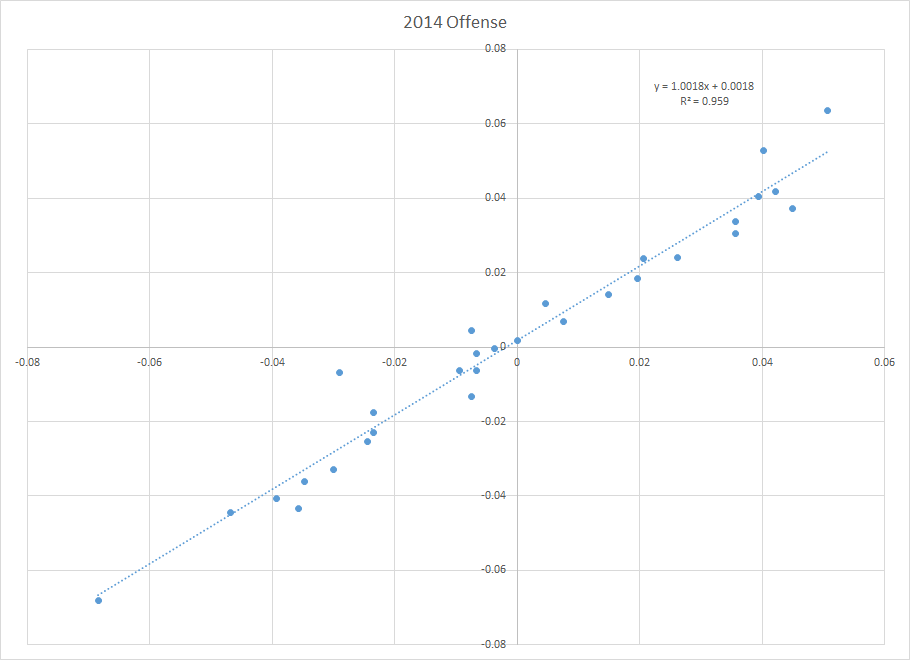
The four factors are... eFG% turnovers rebounding free throw rate With these and only these you can totally describe a team's offense and defense, and therefore their expected win-loss record. But how do we weight them? Dean Oliver, their inventor, suggests 40/25/20/15. In this paper I will demonstrate that everything that guy just said is b***shit. I calculated the relative Rtgs and factors for every team-season from 1984 to 2013. I then looked for couplets where three of the four factors agreed to within .001, and graphed the the difference in Rtg+ against the difference in fourth factor. For example, here is the graph for own eFG%:  I did this with all eight factors and obtained a model of 65/20/10/05, then tried the model on the four factor data for the 2014 season:  Clearly this method is awesome and I am right. This is my conclusion. A+ |
|


